
A recurring claim is that OOP languages, in general, are faster than FP languages – or specific to .Net, C# is faster than F#. So today, we take a look at the myth about F# being slow.

A recurring claim is that OOP languages, in general, are faster than FP languages – or specific to .Net, C# is faster than F#. So today, we take a look at the myth about F# being slow.
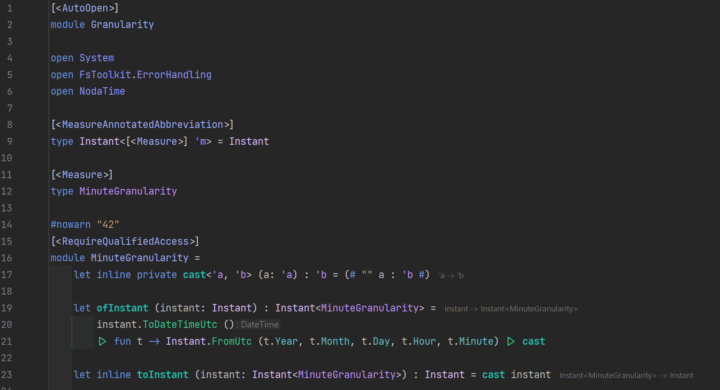
We use NodaTime in our application to deal with time. As you may remember, time is very important in our application – it’s a attendance time-tracking tool with duty planning and many more features. For example, we use Instant to model a point in time. But sometimes, we need a point in time with a granularity of minutes, not nanoseconds. Instead of introducing our own type to model an instant with minute granularity, we use an Instant with a measure. Let’s see how this works:

A typical conversion: Me: “Did you take a look at F#?”Paul*: “No, it’s just too hard to learn!”Me: “Why?”Paul: “I don’t understand anything because of the syntax.” *Paul = Person assuming unyielding learning F# isn’t hard to learn. But you probably have to learn four concepts that you may never have seen before** **unless you have experience in other functional programming languages Let’s see these concepts and how you can...
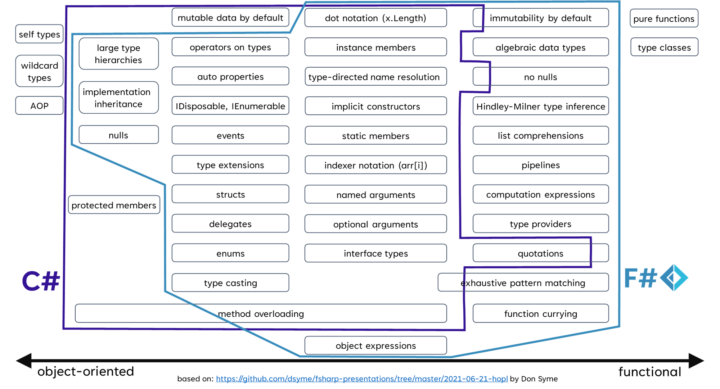
I was invited by JetBrains to talk about OOP and FP and how C# and F# support these paradigms.
Here, you can find the Recording.
And here are the slides.
Happy combining of OOP and FP in your code!
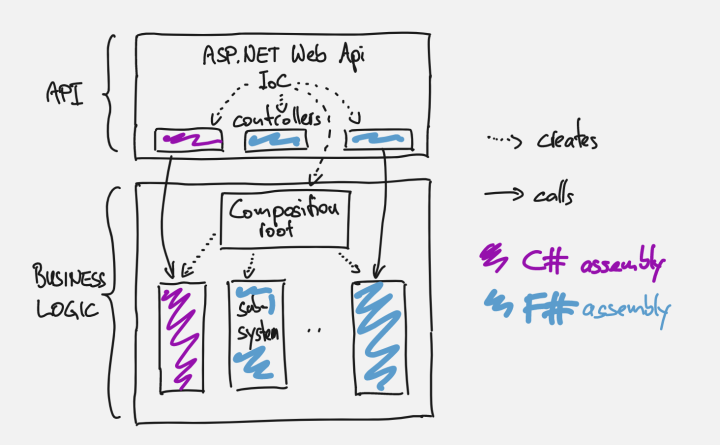
Most code running on .Net is written in C#. So when you consider writing some code in F#, you probably already have a good amount of C# code. C# code you want to keep. It probably doesn’t make economic sense to port C# code to F#.
The good news is that you can start using F# anyway. F# and C# have excellent interoperability.
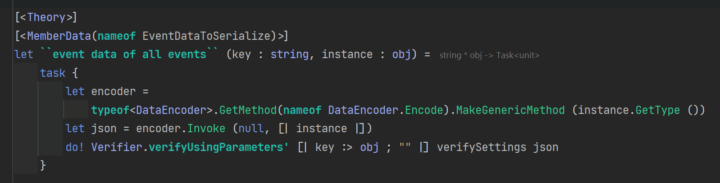
We use event sourcing in many sub-systems of our application to store data. We serialize the data of the events as JSON and store the JSON in the database. To ensure that we don’t change the structure of these event data and by this introduce backward compatibility issues, we use Verify to snapshot test the event data.
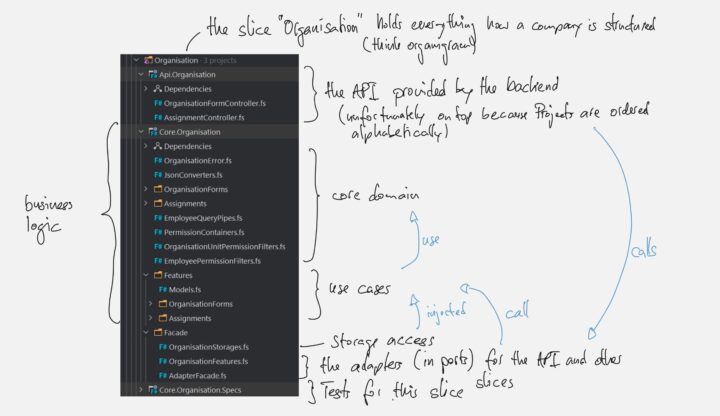
A frequent question I get is how to structure a codebase in F#. There is not much about this topic out there on the Internet. So here is how we structure our code:
Just today, I read on a social media platform that the author doesn’t like that most programming languages incorporate more and more functional features. The post was accompanied by a short example of pattern matching in C# using some of the features introduced in the latest updates. More generally, I hear and read repeatedly from people that tried to write code in a more functional programming style in C# but weren’t happy with the resulting code. The code was just too hard to read...

A myth about F# that I hear repeatedly is that imperative code (e.g. loops) is simpler than functional code (e.g. folds). On one hand, simplicity is very subjective. On the other hand, simplicity is mostly determined by familiarity.
A typically used example is something like the following:
Simple:
Difficult:
Let’s see what’s wrong with this myth.
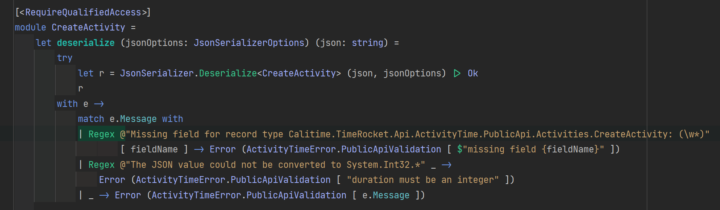
Active patterns make using a Regex in F# neat: The matched groups are returned in the list after the pattern. Here is an example from our codebase:
Pattern found at Active Patterns – F# | Microsoft Learn: